


A mid-season year-to-date check on the two things that make a spring market work: new listings and contract signings
Key Findings
- At the start of 2026, the Realtor.com® Market Clock found the U.S. housing market was in balance between buyers and sellers — but balanced and active are not the same thing. A market can be balanced at a standstill, which is largely where we’ve been, but a look at spring as a whole suggests that signs of a pick up are emerging.
- This report tracks the full arc of spring 2026 using two measures of market dynamism: new listings and contract signings nationwide and across the top 50 metros.
- New listings and contract signings are each at their highest levels since 2022, and both are up year over year in the majority of the top 50 metros.
- Pricing realism is emerging as the key differentiator: where sellers are pricing lower right from the start rather than listing high and cutting later, buyers are showing up.
- May and June will tell us whether this spring’s momentum and resilience is real. But the early data suggests the housing market is more dynamic in 2026 than it has been since rates first surged in 2022.
In This Report
Introduction
Spring is when the housing market is supposed to come to life, as sellers finally decide to list and buyers first commit to buy. And while a busy springtime does not usually generate enough momentum to sustain a housing market throughout the year, a particularly slow spring can be more than enough to knock the market off track.
For the past three years, that spring awakening has promised far more than it’s delivered. Most recently in 2025, higher-than-expected mortgage rates and tariff-driven economic uncertainty kept buyers and would-be sellers on the sidelines, and transaction volumes hovered near thirty-year lows as a result. The hope heading into 2026 was that this spring might finally be different. And over the past month or so, there have been genuine signs of resilience in the face of real economic headwinds stemming from the War in Iran.
“But a resilient market is not necessarily a dynamic one.”
The national housing market (and 29 of the 50 largest metros) entered this spring roughly balanced between buyers and sellers, but balance doesn’t generate transactions — it simply means neither buyers nor sellers have the upper hand in negotiations. A market can be balanced at a standstill, with too little supply and too little demand to move the needle in either direction.
Ideally, market activity should be increasing this time of year, not merely struggling to withstand shocks in order to remain at a standstill. So when is a housing market active and dynamic? When there are new entries and successful exits: homes coming on market in the form of fresh listings and coming off as they go under contract.1
This report sets out to track those movements in the spring housing market. Rather than a single month’s snapshot, we’re tracking the full arc of the year to date — January through April — at the national, regional, and local level across the top 50 metros. The lens is intentionally simple: entries and exits. Are sellers coming to market? Are buyers responding? To sharpen that demand signal, we’re introducing a new measure — contract signings — which tracks the flow of homes entering into ‘pending’ status each month rather than the static stock of homes already pending. Paired with new listings on the supply side, these two flows give us a fuller picture of market dynamics. Where both are rising, the market is genuinely moving.
What follows is a mid-spring progress report on where that action is happening, where it isn’t, and why. We’ll look at how 2026’s trajectory compares to the past four springs nationally and by region. We’ll map which metros have real two-sided momentum and which don’t. And we’ll make the case that what separates moving markets from stagnant ones comes down, more than anything else, to how realistically sellers are pricing their homes.
1 It’s worth noting that there are other types of listing exits that fall into the “not successful” bucket. We’ve examined both delistings — homes that sellers move out of for-sale status without any indication of a contract or sale — and contract cancellations — homes that were in pending status and return to active status. Earlier explorations of both these types of listing suggest nothing unusual about their trends so far in 2026, so we aren’t focusing on them in this research.
Back to top
The Big Picture So Far
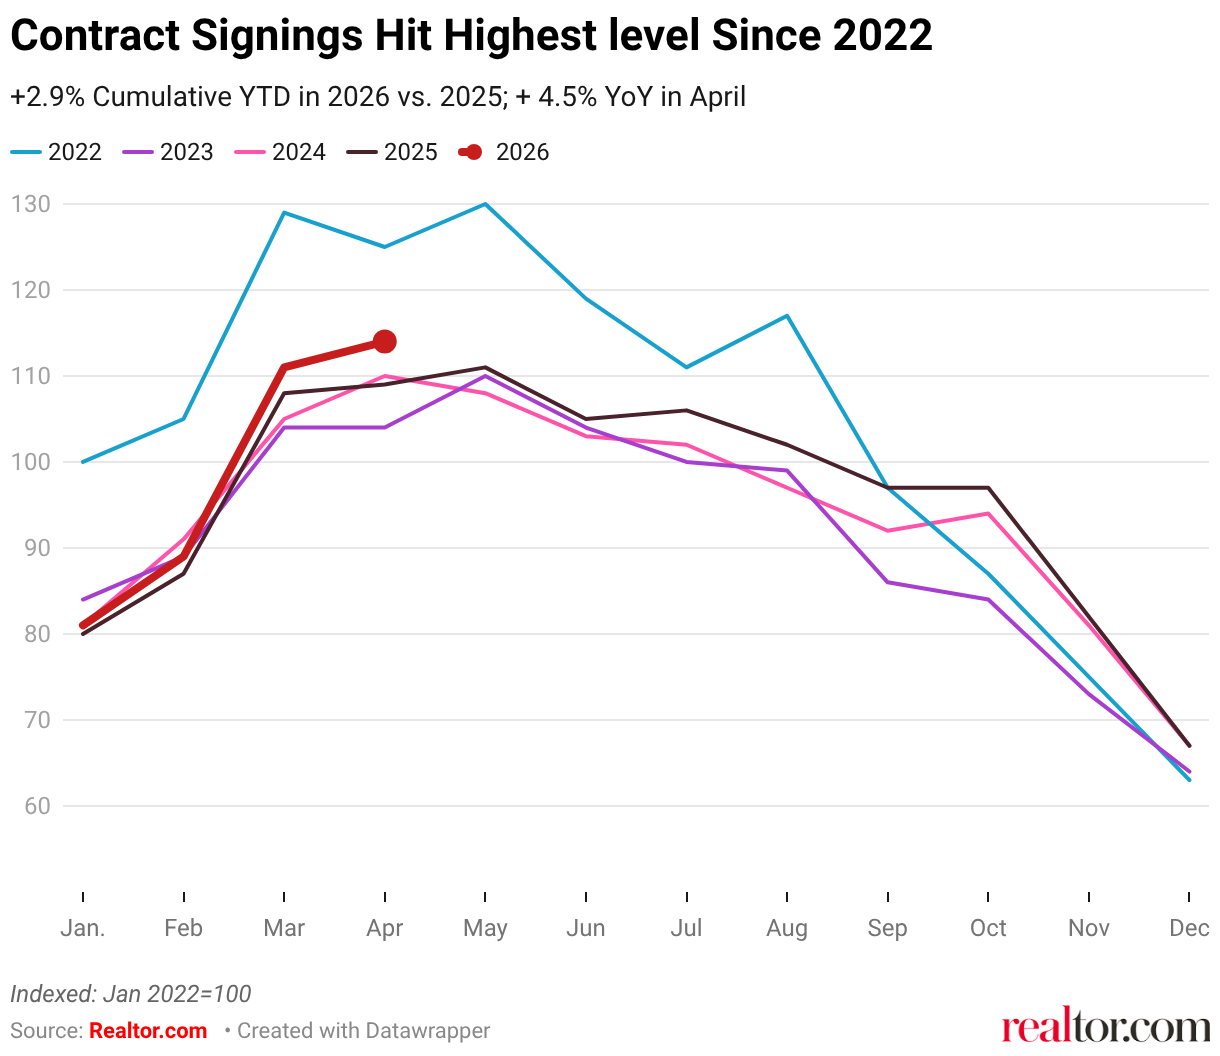
The simplest way to take stock of the spring season is to count what’s coming on market and what’s going under contract, and then compare that to where things stood in recent years. The two charts below do exactly that, indexing both new listings and contract signings to their January 2022 levels and tracking through April 2026.
New Listings: Relief and Resilience
On new listings, the story is one of relief and resilience. Supply in the form of newly listed homes in 2026 is running almost exactly in line but just ahead of 2025 through April. That makes 2026 the strongest year for new listings since 2022. As we wrote in March and April, the reason for cautious optimism around the new listings picture is not because of eye-popping gains, but rather because sellers have not wavered in listing homes despite volatile and uncertain economic conditions shifting under their feet.
Contract Signings: A Break From the Lower Equilibrium?
The outlook on contract signings (or homes moving to ‘pending’ status) is where this spring gets more interesting. After 2022’s rate shock, contract activity fell sharply and then flatlined. From 2023 through 2025, contract signings tracked in a remarkably tight band, running 20 to 25 points below 2022 levels at every point in the spring season. The market had settled into a lower equilibrium, and nothing in the past two springs was enough to break it.
This spring looks different, or at least more promising, so far. For the first time since that reset, 2026 signings are running consistently above the prior three-year cluster, not necessarily by a dramatic margin, but at a clip that has been slightly widening as the year has progressed. In April 2026, the number of newly pending listings (i.e. the number of homes that went under contract) was up 4.5% YoY, an acceleration from a 2.9% YoY increase in March.
“For the first time since that reset, 2026 signings are running consistently above the prior three-year cluster — a credible signal that buyer demand may be finding its footing again.”
This matters because it’s a credible signal that buyer demand and home sales may be finding its footing again after two years of stagnation, and this appears to be falling in line with our expectation that home sales would make a small but meaningful gain from the 30-year low level where it’s been stuck.
Beyond the spring data itself contract signings are a leading indicator for existing home sales, as homes that go under contract today typically close in 30 to 60 days. (Indeed NAR data also find pending home sales growth leading existing home sales growth this spring.) If this demand signal holds, it should translate into a meaningful uptick in closed sales in May and June, months that are typically the strongest seasonally, something the market has been waiting on for the better part of three years.
One important clarification: this isn’t a story of demand racing ahead of supply. Active inventory is still up year over year and homes are still sitting longer on the market than they were a few years ago. What’s changed is the relative strength of demand compared to the recent past. In a market where the biggest problem has been buyers sitting on the sidelines, even a modest improvement in contract activity is an important development.
Whether this momentum holds, picks up, or fades is the central question of the second half of spring. The promise-to-peril arc that defined the first four months of 2026 — early optimism, geopolitical shock, surprising resilience — is far from settled and likely won’t be until there’s some resolution in the Middle East.
Adding Up the Score: Year-to-Date Through April
With four months of data in hand, we can now add up the score. How many homes have actually come to market this spring, and how many have gone under contract? We can then compare that year to date activity to the previous several springs and see how 2026 stacks up so far.
The table below shows nationally the total number of newly listed homes is up 1.1% relative to 2025 and 22% compared to 2023. Moving to the total number of newly pending listings, they’re up 2.9% nationally in 2026 versus last year, and 4.1% compared to their trough in 2023.
| New Listings | Contract Signings | ||||
| YTD vs. 2025 (%) | YTD vs. 2023 Trough (%) | YTD vs. 2025 (%) | YTD vs. 2023 Trough (%) | ||
| National | +1.1 | +22.0 | +2.9 | +4.1 | |
| Northeast | +1.0 | +9.4 | −1.6 | −2.9 | |
| Midwest | +4.3 | +17.3 | +2.7 | +8.1 | |
| South | +1.5 | +24.6 | +3.5 | +1.5 | |
| West | +0.9 | +32.9 | +3.9 | +9.8 | |
From a national standpoint, both of these signal some positive momentum in housing market activity, which we expect to be reflected in the official existing home sale statistics in the coming months as a contract signed today will close in the coming weeks. Through the first four months, 2026 does indeed look more dynamic and less static than it has since 2022 — not necessarily a high bar to clear but a good sign nonetheless. Supply has recovered faster than demand (note that new listings are 22% above their 2023 trough nationally while contract signings are just 4% above theirs) but the gap is narrowing, with growth in contract signings this year outpacing new listings growth.
This pattern tends to hold regionally as well. Total new listings year to date are up compared to 2025 in each of the 4 major regions, but especially in the Midwest. Total homes that have gone under contract so far this year (newly pending listings) are up everywhere but the Northeast, a region that was hit particularly hard by winter storms in the early months of 2026 which likely tamped down or delayed activity. We expect some bounce back in both new listings and contract signings in the Northeast in the coming months (new listings momentum has already picked up in April and contract signings lag new listing growth).
Back to top
Where Is the Market Actually Moving?
So far we have established that housing market activity — at least when looking at the flows of new listings and contract signings — has slightly rebounded in 2026 to date (Ultimately, the eventual closed sales numbers will have the final say). And while a national uptick in both new listings and contract signings is encouraging, aggregates can paper over regional fragmentation.
Overall, 34 of the top 50 metros have more contract signings so far in 2026 than Jan–Apr. 2025, and 31 have more new listings so far in 2026 than through the same time in 2025. So the trends are widespread. But do these two metrics move together?
The figure below plots the relationship between year to date total new listing growth versus year to date total contract signings for the top 50 metros. And two main findings emerge. First, new listing activity and contract signings do move together; where more homes are coming on market, more are going under contract. Second, the scatter is wide, revealing important variation in local conditions. This variation echoes the fragmented nature of the 2026 housing outlook that we identified in our inaugural Market Clock report.
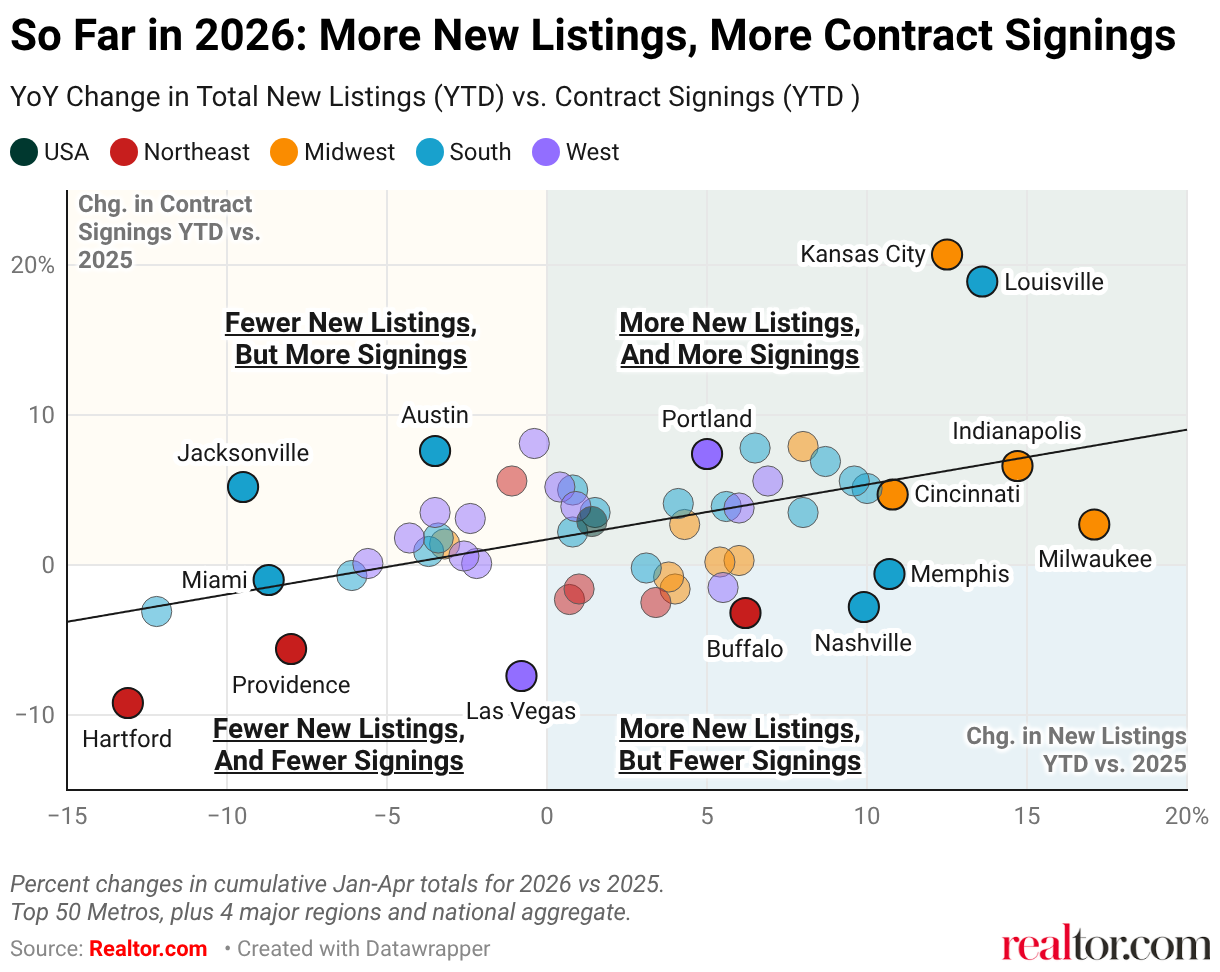
Upper Right: Two-Sided Momentum
Of the top 50 metros, 21 sit in the upper-right quadrant, where both new listings and contract signings are up year over year. These are the markets genuinely delivering on the spring awakening promise. The Midwest dominates this quadrant: Kansas City (+12.5% listings, +20.7% contract signings), Louisville (+13.6%, +18.9%), Indianapolis (+14.7%, +6.6%), Columbus (+8.0%, +7.9%), and Cincinnati (+10.8%, +4.7%) all show strong two-sided momentum. These markets combine relatively affordable price points, improving inventory, and buyers who are actually showing up. So far in 2026, the housing market is most active between the Appalachians and the Rockies.
“So far in 2026, the housing market is most active between the Appalachians and the Rockies.”
Upper Left: New Demand Without New Supply
The more surprising story, however, is in the upper-left quadrant, where contract signings are rising despite fewer new listings than last year. Phoenix (−0.4% listings, +8.1% signings), Austin (−3.5%, +7.6%), and Jacksonville (−9.5%, +5.2%) all fit this profile. These markets have seen significant price corrections over the past two years, and the data suggests buyers are responding — even if new listing activity has flattened.
Lower Right: New Supply Without New Demand — One to Watch
The lower-right quadrant — listings up, pendings down — is one to watch in the coming months. Milwaukee (+17.1% listings, +2.7% pending), Memphis (+10.7%, −0.6%), and Nashville (+9.9%, −2.8%) all have supply arriving without a clear demand response yet. This isn’t necessarily a warning sign, as even in hot markets contract signing growth necessarily lags new listing growth, so some of these markets may simply be in the process of converting supply into sales. If pending growth catches up by June, these markets graduate to the top right. If it doesn’t, it raises harder questions about whether the supply is priced right.
Lower Left: Where the Spring Awakening Hasn’t Arrived
Finally, there are the markets in the lower left (fewer listings and fewer sales) where the spring awakening simply hasn’t arrived — but potentially for different reasons. Tampa (−12.2% listings, −3.1% pending), Las Vegas (−0.8%, −8.4) stand out for one reason, while Hartford (−13.1%, −9.2%), and Providence (−8.0%, −5.6%) stand out for another. The former two are stagnant because of low demand (e.g. days on market are up by over a week year on year in Tampa and Las Vegas); the latter two are stagnant because of low supply — inventories in Hartford and Providence remain well below pre-pandemic norms and time on market is actually falling compared to last year.
What the Market Clock Tells Us
In sum, the pattern of which markets are most and least active is not random. At the start of the year, the Realtor.com Market Clock placed 8 of the top 50 metros in buyer’s market territory, with nearly all of them in the South. So far in 2026, almost all of those buyer’s markets have seen fewer new listings than last year. Why? Sellers know the market is not in their favor. Two of those buyer’s markets, Jacksonville and Austin, have seen big gains in contract signings though. Why? Because sellers on-market there have dropped their initial list prices to attract potential buyers. Those buyers markets in the top left now show some of the strongest contract signing growth despite falling new listings. This suggests the price corrections that pushed them into buyer’s market territory are now doing the work of unlocking demand. Interestingly, of the 13 seller’s markets on the Market Clock at the start of the year, some, like Kansas City and Columbus, can be found in the top right quadrant (new listings growth and contract signings growth), while others, Providence and Hartford, look more stagnant in the bottom left of the figure. Why? A seller’s market doesn’t necessarily mean lots of activity; it simply implies that sellers have more leverage, as hopeful buyers outnumber available homes. In far under-supplied markets like Providence and Hartford, sellers can maintain leverage precisely because the rate of new listings and transactions is low.
Back to top
Why Do Some Markets Move and Others Don’t? Sellers Got Real
Throughout this spring, the markets where asking prices are falling the most are also the markets seeing the fewest price cuts relative to last year. Nationally, the median list price per square foot is down 2.4% year over year in April and yet the share of listings with a price cut is also down, by 1.25 percentage points. While that might seem counterintuitive at first glance, it’s entirely consistent with a story of sellers learning and pricing more realistically.
The scatter plot below illustrates this relationship across the top 50 metros. The pattern is clear: where price per square foot has fallen the most year over year in April, price cut share has tended to fall too. Sellers in these markets have done the recalibration work upfront, clearly learning from last year when list prices in many struggling metros failed to soften despite building inventory and low demand. It appears that this spring, sellers are initially listing at a price that moves, thereby avoiding the corrective price cuts that signal a mis-pricing or distress.
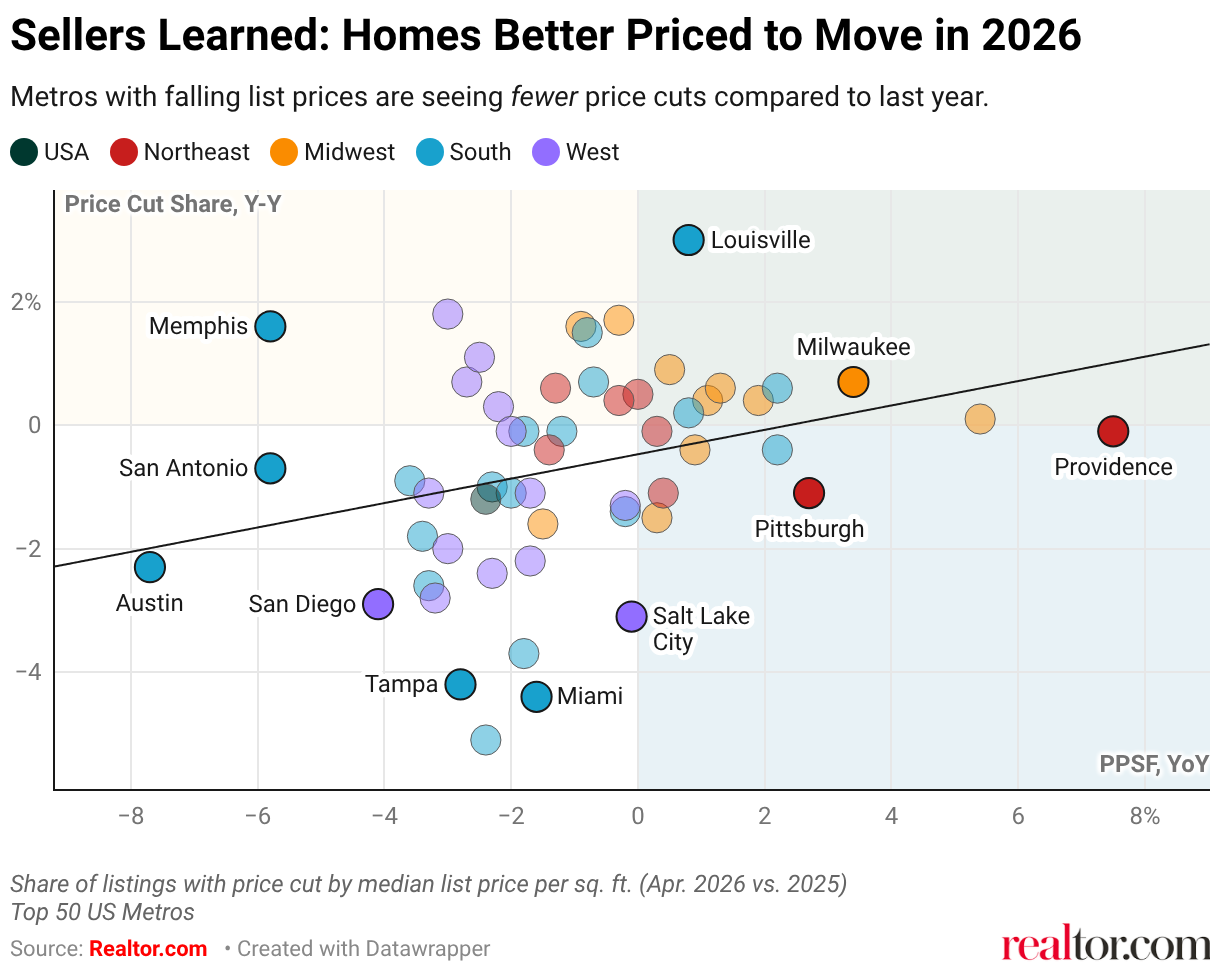
Several Southern metros make the case most vividly. Austin has seen asking prices per square foot fall 7.7% year over year — the steepest decline among the top 50 metros — yet price cut share is down 2.3 percentage points. Jacksonville, where prices are down 2.4%, has seen price cuts fall by a striking 5 percentage points. Dallas, San Antonio, Miami, and Tampa all follow the same pattern. These are markets that absorbed significant price corrections over the past two years and where sellers may be recalibrating accordingly. Crucially, these are also many of the same markets that appeared in the upper-left quadrant of our previous chart, where contract signings are rising even without a surge in new supply. Together, this implies more realistic pricing does the work that new supply alone cannot.
“The markets generating the most exit activity this spring aren’t necessarily the ones with the most supply. They’re the ones where sellers have stopped fishing and started selling.”
The bottom line is that creating a more dynamic housing market requires not only the buyers to have the confidence and financial footing to enter and sellers to have the urgency to list, but also each having realistic expectations about market prices and what underlies them: both how much a seller values their property and what buyers are willing to pay.
Back to top
Conclusion
The next two months are where the rubber meets the road. May and June data will tell us whether 2026 is genuinely breaking out of that lower equilibrium, or whether it’s the latest spring to promise more than it delivers.
|
Upside Scenario Some resolution to Middle East uncertainty steadies mortgage rates and restores enough consumer confidence to smoothly lift the housing market out of its recent selling season rut. |
Downside Risk Rates continue to climb, inflation reaccelerates, and the macro uncertainty the spring market has so far absorbed finally catches up with it — much like the tariff trade shocks last year. |
The path to an unstuck market runs through buyer activity. And so far, the housing market has beaten low expectations this spring, leaving us cautiously optimistic about sales in the key volume months of May and June. Importantly, the market doesn’t need to start favoring sellers or bend further toward buyers to feel meaningfully more dynamic. A more dynamic housing market just needs increased engagement from both buyers and sellers simultaneously. That is the straightforward path to a balanced-and-active scenario the housing market has been waiting three years to find.
Over the next few months, American families will undoubtedly continue to grapple with broader economic uncertainty, but the data suggests that better alignment in price expectations between buyers and sellers could be the key to unlocking the 2026 housing market.
Back to top
Appendix: Top 50 Metro Data
All figures are year-over-year percentage changes or percentage point differences. YTD = January through April 2026 vs. January through April 2025. ▲ = both new listings & signings up YTD | ◆ = mixed | ▼ = both down YTD
| Metro | Trend | New Listings Apr YoY | New Listings YTD vs. ’25 | Signings Apr YoY | Signings YTD vs. ’25 | PPSF Apr YoY | Price Cuts Apr (pp) |
| National & Regional | |||||||
| USA | ▲ | +1.1 | +1.1 | +4.5 | +2.9 | −2.4 | −1.3 |
| Northeast | ◆ | +9.4 | +1.0 | +5.1 | −1.6 | −0.3 | +0.4 |
| Midwest | ▲ | +6.6 | +4.3 | +3.7 | +2.7 | +1.3 | +0.6 |
| South | ▲ | +0.6 | +1.5 | +5.0 | +3.5 | −3.4 | −1.8 |
| West | ▲ | −3.5 | +0.9 | +4.0 | +3.9 | −1.7 | −1.1 |
| Top 50 Metros | |||||||
| Atlanta, GA | ◆ | −4.1 | −3.7 | +1.9 | +0.9 | −0.2 | −1.4 |
| Austin, TX | ◆ | −13.5 | −3.5 | +8.0 | +7.6 | −7.7 | −2.3 |
| Baltimore, MD | ◆ | +3.6 | +3.1 | −3.9 | −0.2 | −0.8 | +1.5 |
| Birmingham, AL | ▲ | +2.5 | +8.0 | +1.5 | +3.5 | +0.8 | +0.2 |
| Boston, MA | ◆ | −3.8 | −1.1 | +9.3 | +5.6 | +0.3 | −0.1 |
| Buffalo, NY | ◆ | −0.4 | +6.2 | +2.4 | −3.2 | +0.4 | −1.1 |
| Charlotte, NC | ▲ | +6.2 | +10.0 | +9.1 | +5.1 | −1.8 | −0.1 |
| Chicago, IL | ◆ | −5.2 | −3.2 | −1.1 | +1.4 | +0.9 | −0.4 |
| Cincinnati, OH | ▲ | +13.7 | +10.8 | +8.0 | +4.7 | −0.3 | +1.7 |
| Cleveland, OH | ◆ | +7.8 | +4.0 | +2.1 | −1.6 | +1.9 | +0.4 |
| Columbus, OH | ▲ | +18.0 | +8.0 | +11.5 | +7.9 | −1.5 | −1.6 |
| Dallas, TX | ◆ | −5.9 | −3.4 | +0.6 | +1.8 | −1.8 | −3.7 |
| Denver, CO | ◆ | −12.6 | −2.4 | +0.6 | +3.1 | −3.2 | −2.8 |
| Detroit, MI | ▲ | +6.7 | +6.0 | +1.9 | +0.3 | +0.5 | +0.9 |
| Hartford, CT | ▼ | −4.2 | −13.1 | −3.6 | −9.2 | −1.4 | −0.4 |
| Houston, TX | ▲ | −3.5 | +0.8 | −0.2 | +2.2 | −2.3 | −1.0 |
| Indianapolis, IN | ▲ | +21.1 | +14.7 | +14.4 | +6.6 | +5.4 | +0.1 |
| Jacksonville, FL | ◆ | −8.1 | −9.5 | +1.8 | +5.2 | −2.4 | −5.1 |
| Kansas City, MO | ▲ | −2.5 | +12.5 | +18.9 | +20.7 | +0.3 | −1.5 |
| Las Vegas, NV | ▼ | −8.8 | −0.8 | −10.0 | −7.4 | −2.2 | +0.3 |
| Los Angeles, CA | ◆ | −3.3 | −2.2 | +3.6 | +0.1 | −3.3 | −1.2 |
| Louisville, KY | ▲ | +19.2 | +13.6 | +16.1 | +18.9 | +0.8 | +3.0 |
| Memphis, TN | ◆ | +9.9 | +10.7 | +1.1 | −0.6 | −5.8 | +1.6 |
| Miami, FL | ▼ | −7.2 | −8.7 | +7.9 | −1.0 | −1.6 | −4.4 |
| Milwaukee, WI | ▲ | +14.3 | +17.1 | +6.0 | +2.7 | +3.4 | +0.7 |
| Minneapolis, MN | ▲ | +10.7 | +5.4 | +8.9 | +0.2 | −0.9 | +1.6 |
| Nashville, TN | ◆ | +7.3 | +9.9 | +12.1 | −2.8 | −1.2 | −0.1 |
| New York, NY | ◆ | +11.4 | +0.6 | −14.8 | −23.1 | −1.3 | +0.6 |
| Oklahoma City, OK | ▲ | +6.5 | +5.6 | +1.3 | +3.9 | −0.7 | +0.7 |
| Orlando, FL | ▼ | −9.0 | −6.1 | −0.2 | −0.7 | −3.3 | −2.6 |
| Philadelphia, PA | ◆ | +9.9 | +3.4 | +1.6 | −2.5 | 0.0 | +0.5 |
| Phoenix, AZ | ◆ | −4.9 | −0.4 | +4.8 | +8.1 | −1.7 | −2.2 |
| Pittsburgh, PA | ◆ | +10.5 | +0.7 | +4.7 | −2.3 | +2.7 | −1.1 |
| Portland, OR | ▲ | −6.1 | +5.0 | +7.8 | +7.4 | −2.7 | +0.7 |
| Providence, RI | ▼ | +3.8 | −8.0 | +2.9 | −5.6 | +7.5 | −0.1 |
| Raleigh, NC | ▲ | +3.6 | +0.8 | +5.6 | +5.0 | −2.0 | −1.1 |
| Richmond, VA | ▲ | +6.3 | +8.7 | +5.5 | +6.9 | +2.2 | +0.6 |
| Riverside, CA | ◆ | −5.6 | −2.6 | +2.0 | +0.6 | −2.3 | −2.4 |
| Sacramento, CA | ▲ | −5.7 | +0.4 | +5.4 | +5.2 | −0.2 | −1.3 |
| St. Louis, MO | ◆ | +4.6 | +3.8 | −1.9 | −0.8 | +1.1 | +0.4 |
| Salt Lake City, UT | ▲ | +2.5 | +6.9 | +1.5 | +5.6 | −0.1 | −3.1 |
| San Antonio, TX | ▲ | +7.3 | +4.1 | +8.5 | +4.1 | −5.8 | −0.7 |
| San Diego, CA | ◆ | −5.5 | −3.5 | +6.7 | +3.5 | −4.1 | −2.9 |
| San Francisco, CA | ◆ | −1.5 | −4.3 | +9.2 | +1.8 | −3.0 | −2.0 |
| San Jose, CA | ▲ | +0.9 | +6.0 | +10.1 | +3.8 | −2.5 | +1.1 |
| Seattle, WA | ◆ | +2.4 | +5.5 | −0.1 | −1.5 | −3.0 | +1.8 |
| Tampa, FL | ▼ | −15.7 | −12.2 | +0.9 | −3.1 | −2.8 | −4.2 |
| Tucson, AZ | ◆ | −13.9 | −5.6 | +2.3 | +0.1 | −2.0 | −0.1 |
| Virginia Beach, VA | ▲ | +23.8 | +9.6 | +5.2 | +5.6 | +2.2 | −0.4 |
| Washington, DC | ▲ | +4.9 | +6.5 | +8.1 | +7.8 | −3.6 | −0.9 |
Back to top
Methodology
Realtor.com housing data as of April 2026. Listings include the active inventory of existing single-family homes and condos/townhomes/row homes/co-ops for the given level of geography on Realtor.com. New construction is excluded unless listed on an MLS that provides listing data to Realtor.com. Realtor.com data history goes back to July 2016. The 50 largest U.S. metropolitan areas as defined by the Office of Management and Budget (OMB-202301) and Claritas 2025 estimates of household counts.
New Listings represent the count of residential properties that were listed for sale for the first time in a given month. Contract Signings represent the flow of homes entering pending status in a given month (i.e. homes that went under contract for the first time in that period). This is a flow measure, not a stock measure. This distinguishes it from the stock of pending listings, which measures the total number of homes under contract at a given point in time regardless of when they entered that status.
Year-to-date (YTD) through April totals are calculated by summing monthly values for January through April of the relevant year. YTD growth rates compare the January-April sum in 2026 to the same four-month sum in the comparison year. For example, a YTD growth rate vs. 2025 reflects the percentage change in total activity over the first four months of 2026 relative to the first four months of 2025. Where noted, comparisons are also made to 2023, which represents the recent trough in both new listings and contract signing activity following the 2022 rate shock.
