


Highlights
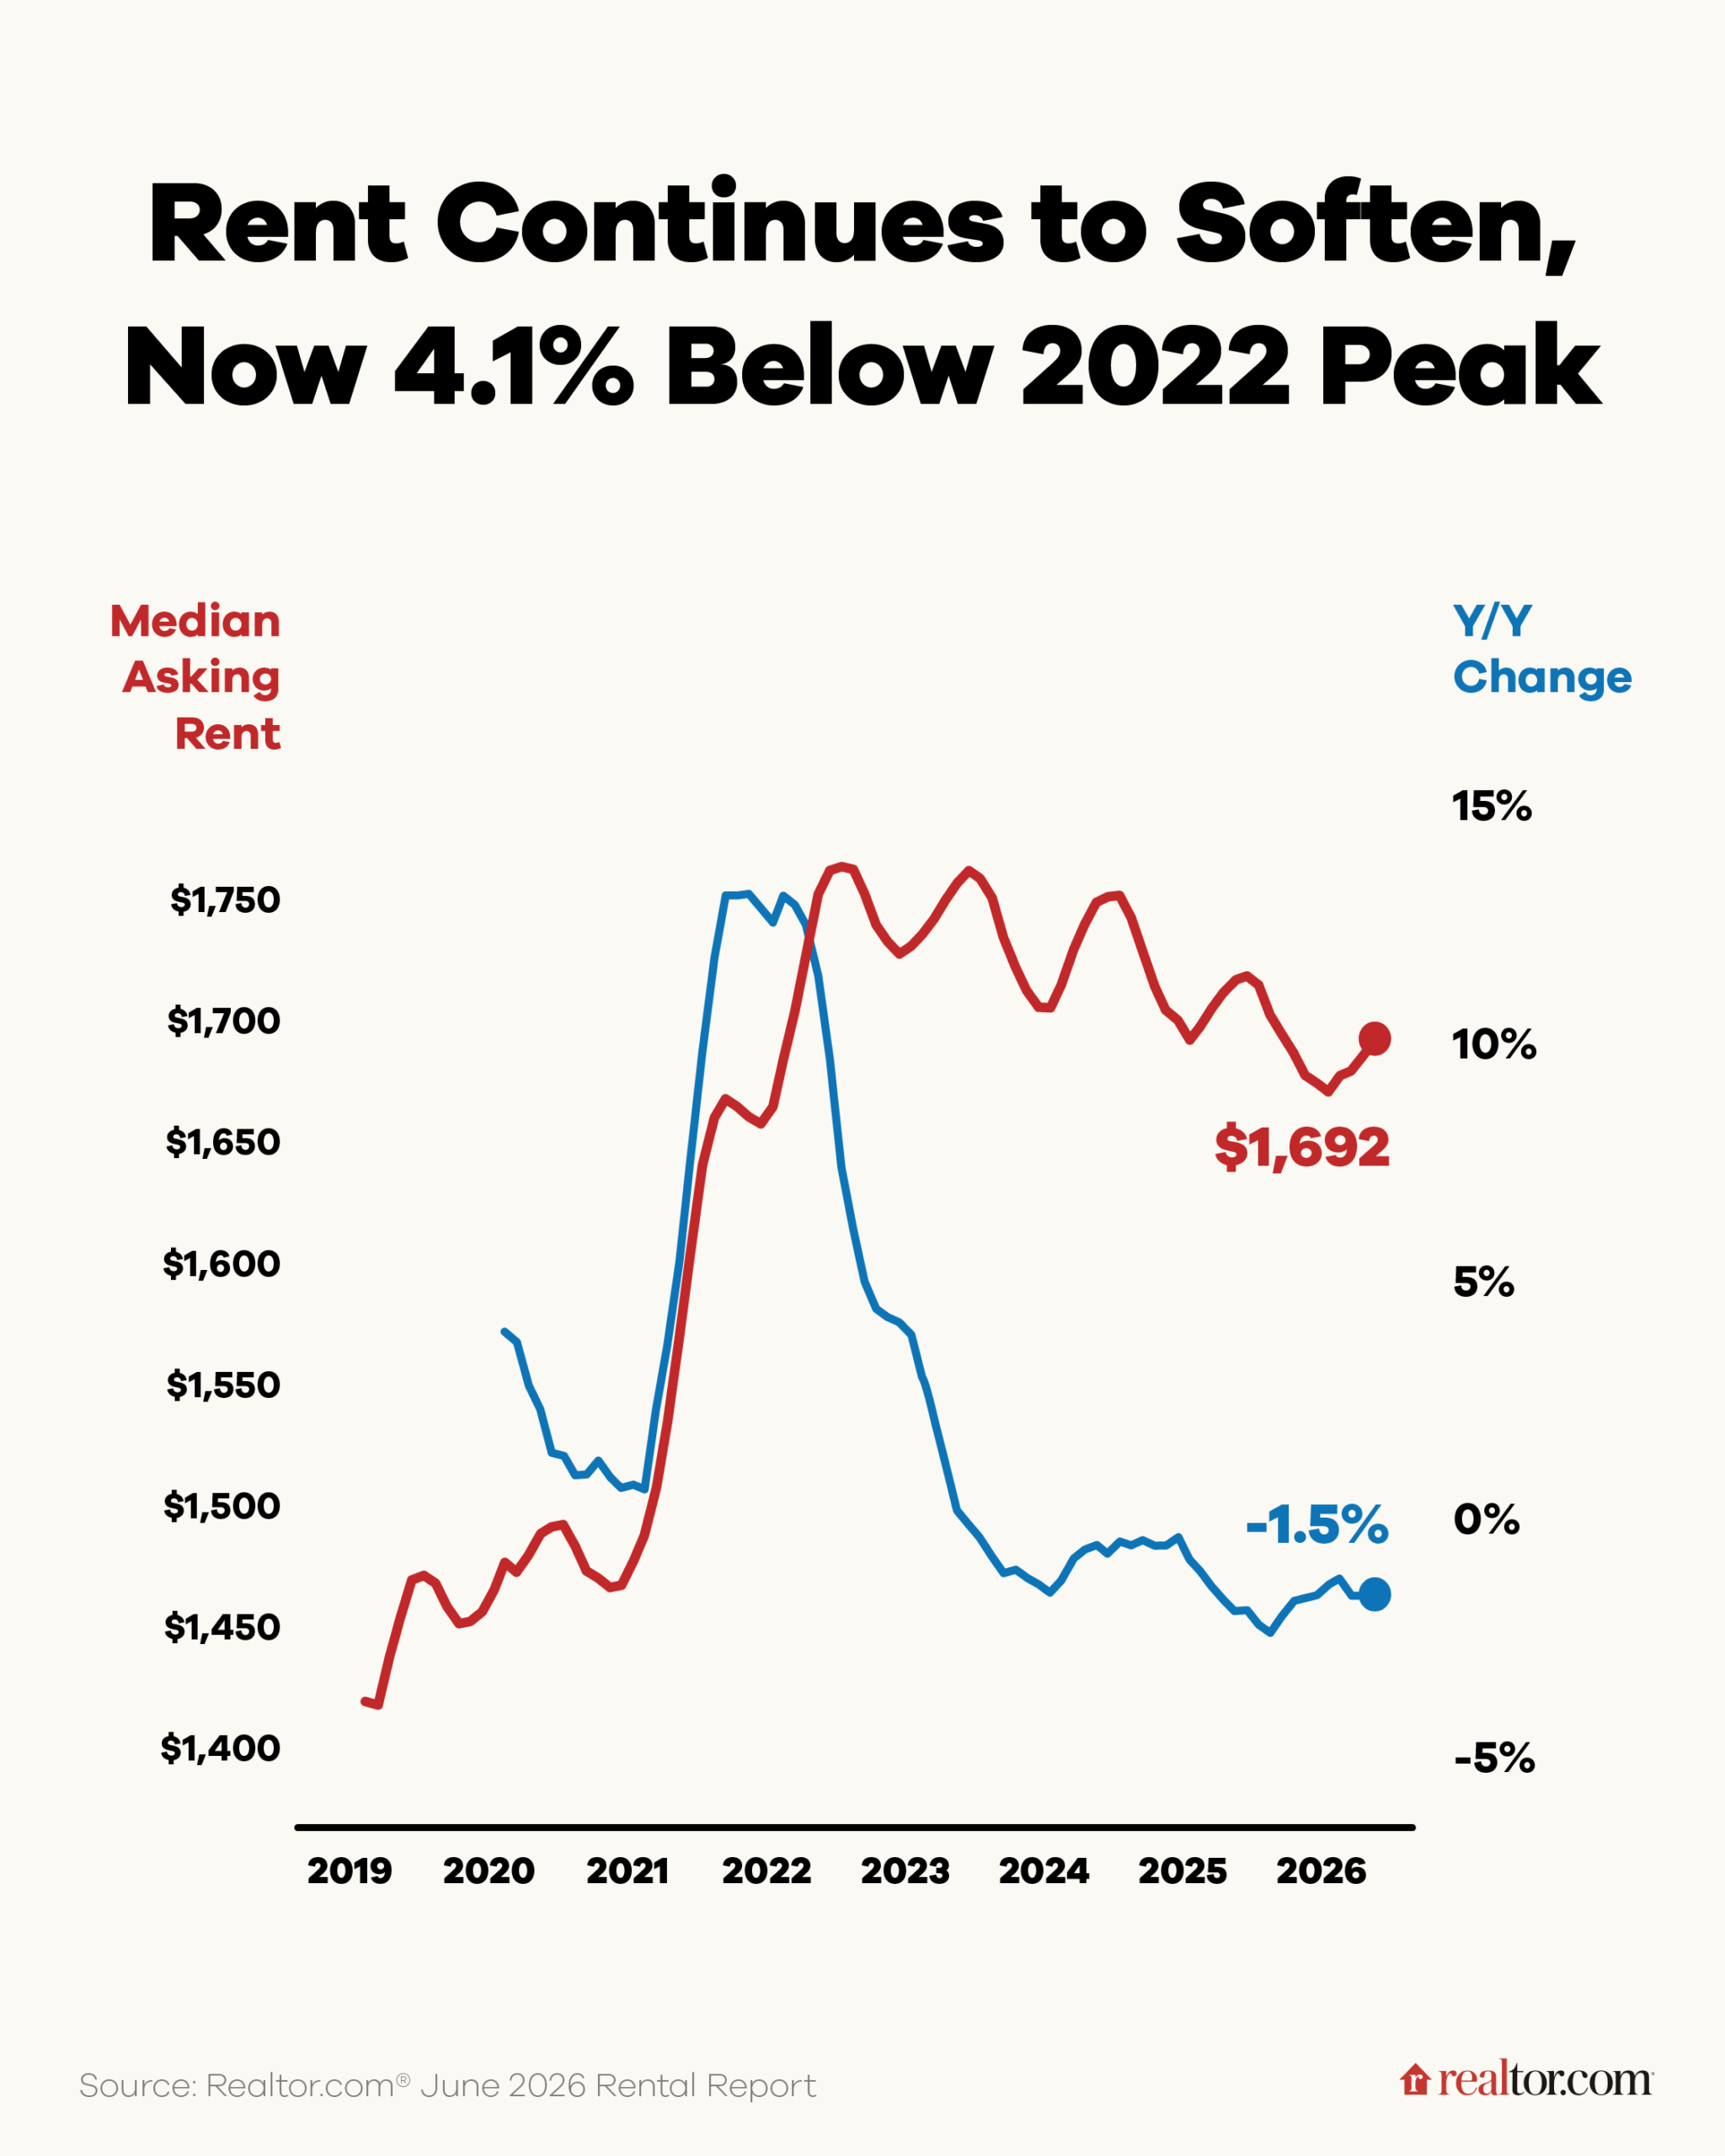
- June 2026 marks the 35th consecutive month of year-over-year decline for 0-2 bedroom properties across the 50 largest metros. The national median asking rent fell $25, or 1.5%, compared to a year ago.
- The median asking rent in the 50 largest metros registered at $1,692, $72 (-4.1%) lower than its summer 2022 peak but $238 (16.4%) higher than the pre-pandemic level.
- Median rent declined in all size categories: studio: $1,422, down $32 (-2.2%) year over year; 1-bed: $1,579, down $22 (-1.4%) year over year; 2-bed: $1,893, down $27 (-1.4%) year over year.
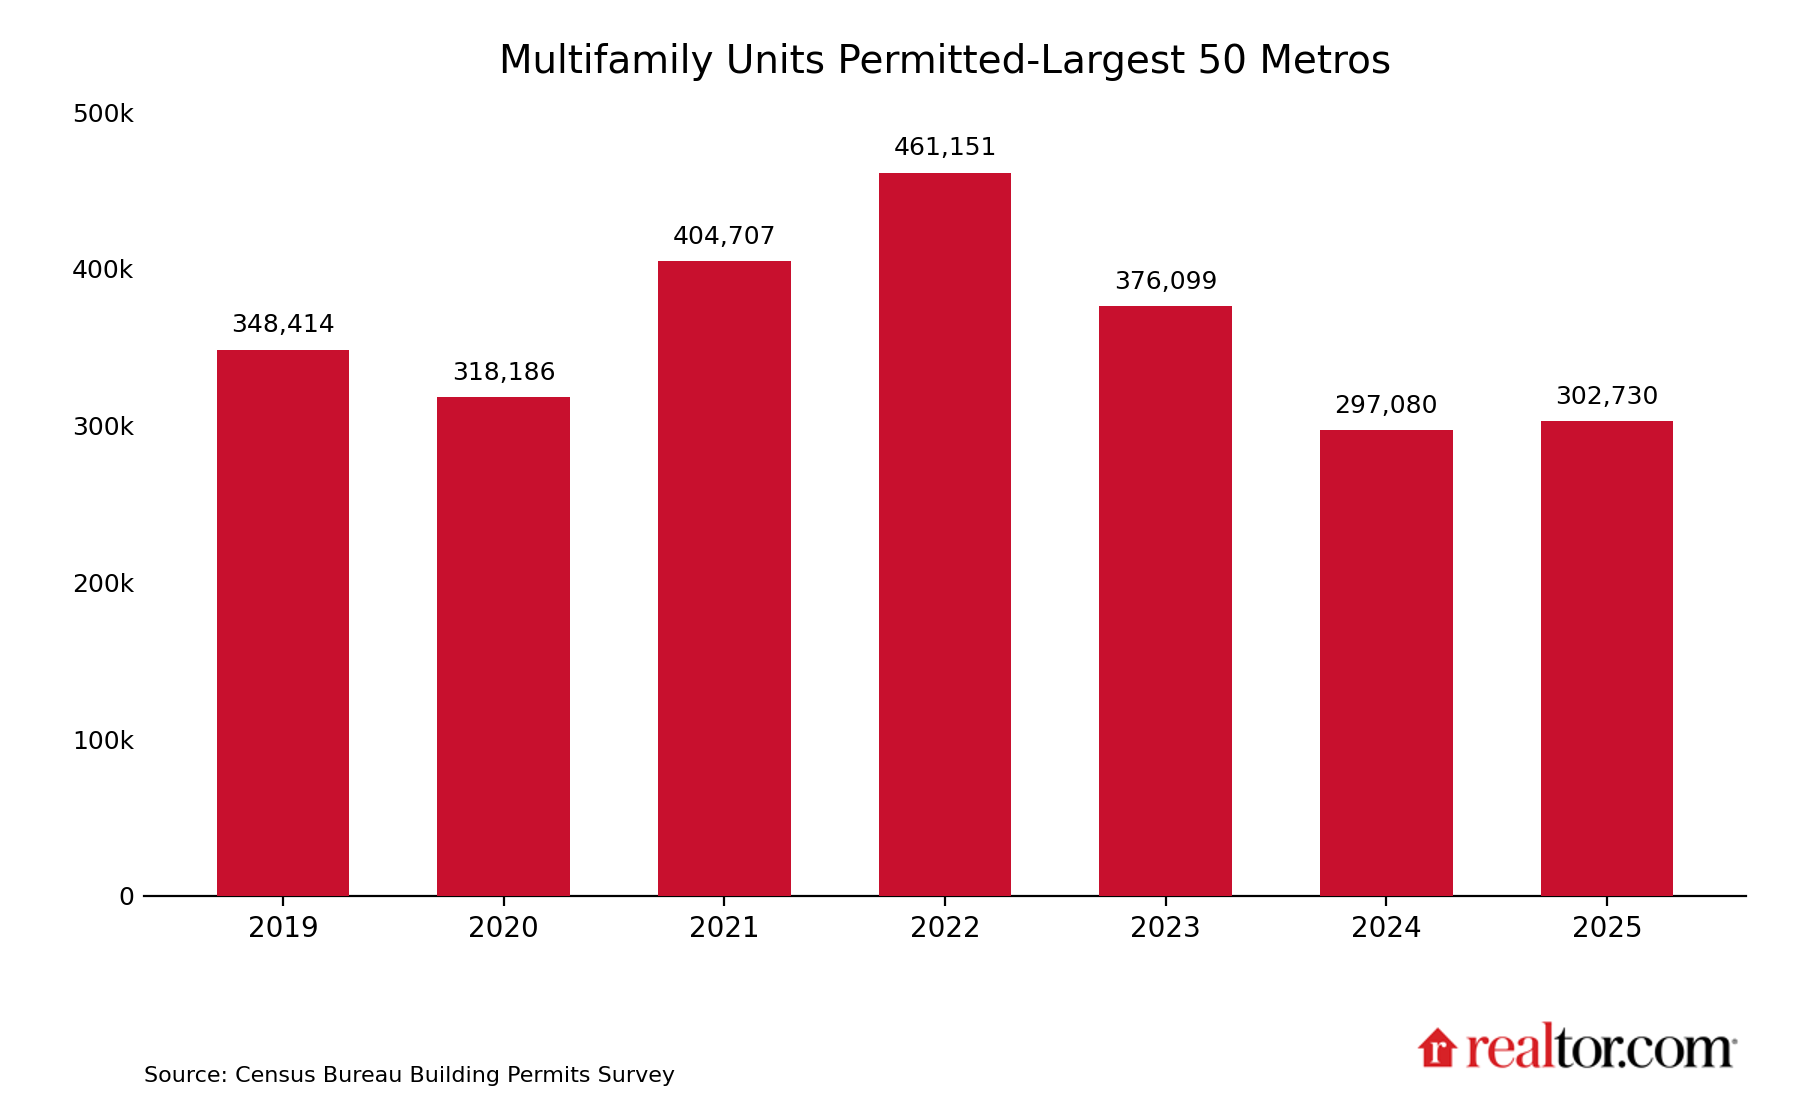
- Permit activity nationally is still 13.1% below 2019 despite a small 2025 rebound, but the recovery is concentrated in specific markets — Florida metros and Columbus, OH are seeing the sharpest gains, the latter tied to the city’s “Zone In” zoning reform enabling up to 88,000 new residential units over the next decade.
- New York and Boston — two markets at the center of 2026’s rent-control debate — posted their lowest permit rates since 2019, underscoring the limits of tenant protections alone: rent freezes and rent-control fights can shield existing renters, but neither market shows the supply pipeline needed to bring broader rents down.
In June 2026, U.S. median rent recorded its 35th consecutive year-over-year decline. Rent for 0-2 bedroom properties across the 50 largest metropolitan areas dropped by 1.5% compared to the previous year, with the median asking rent at $1,692—$25 lower than the prior year.
While the median asking rent remains $238 (16.4%) above pre-pandemic levels recorded in June 2019, it has fallen $72 (-4.1%) from its August 2022 peak. This persistent softness is increasingly translating into real savings for renters navigating a market that once felt out of reach.
As we enter the summer, we expect the median asking rent to tick up on a monthly basis—a typical seasonal pattern. However, given the surge in multifamily construction over the past few years, we anticipate continued year-over-year declines. In other words, modest rent relief is likely to continue in 2026.
All unit sizes saw rent declines
In June 2026, the median asking rent for two-bedroom units dropped 1.4% year over year, marking the 37th consecutive month of annual declines. At $1,893, the national median for two-bedroom units now sits $75 (-3.8%) below its July 2022 peak. Despite this extended period of softness, two-bedroom rents remain $296 (18.5%) above their level seven years ago.
The rent for one-bedroom units slipped 1.4% in June 2026 on a year over year basis, and now stands at $1,579. This was the 37th consecutive month of annual declines. Rent was $82 (-4.9%) lower than the peak observed during August 2022, but still $217 (15.9%) higher than in June 2019.
In June 2026, the median asking rent for studios fell by 2.2%, marking the 34th consecutive month of annual declines. The median rent of studios was $1,422 in June, down by $64 (-4.3%) from its peak, seen in October 2022. Nevertheless, the median asking rent for studios was still $185 (15.0%) higher than seven years ago.
Table 1: National Rents by Unit Size, June 2026
| Unit Size | Median Rent | Rent YoY | Consecutive Months of Decline | Total Decline from Peak | Rent Change – 7 Years |
| Overall | $1,692 | -1.5% | 35 | -4.1% | 16.4% |
| Studio | $1,422 | -2.2% | 34 | -4.3% | 15.0% |
| 1-Bedroom | $1,579 | -1.4% | 37 | -4.9% | 15.9% |
| 2-Bedroom | $1,893 | -1.4% | 37 | -3.8% | 18.5% |
Rent regulations vs. rent construction
While the median asking rent has retreated for nearly three years, rental affordability remains one of the defining topics in today’s housing market. In June 2026, Mayor Mamdani’s rent freeze was approved by the Rent Guidelines Board in New York CIty , while the Massachusetts supreme judicial court struck down a ballot measure for statewide rent control, keeping it off the November ballot. The divergent outcomes highlight a deeper question at the heart of housing policy: rent regulations versus rental construction. Rent regulations such as rent control and rent freeze can protect existing tenants from rising rents, but they do not directly expand supply or broadly reduce market rents — which is where multifamily permitting data becomes essential to understanding whether a market has a real path to affordability.
In 2025, 302,730 units in projects of five units or more were permitted for construction across the 50 largest metropolitan areas in the United States — a level 1.9% higher than 2024, but 13.1% lower than 2019 and 34.4% lower than the 2022 peak. This retreat raises concerns about the long-term path to affordability, since a permitting pipeline that remains well below pandemic levels suggests the supply-side progress that has driven rents down over the past three years may not last much longer.
However, local variance exists — some markets could still accelerate even as the national trend cools. To compare permit activity across metros and over time, we normalize the number of permits by total population, a measure we refer to as the permit rate. The metro-level permit data is sourced from Building Permits Survey (BPS) and population data is sourced from Moody’s estimates.
Markets at the lowest permit rate since 2019
The table below includes the eleven markets where the 2025 permit rate was the lowest since 2019. New York, NY metro stands out with only 1.6 new multifamily units permitted for every 1,000 residents — not an encouraging trend given the upcoming rent freeze on rent-stabilized units in NYC, which could push market-rate rents higher without new supply to offset it. Boston, MA also caught our eye, with just 1.1 new multifamily units permitted for every 1,000 residents. While the collapse of Massachusetts’s rent control initiative removes one risk to future supply, the market’s already-thin permitting activity and low-affordability likely gave rise to the push for rent restrictions.
Table 2: Markets at the lowest permit rate since 2019
| Market | Permit Rate, 2019 | Permit Rate, 2020 | Permit Rate, 2021 | Permit Rate, 2022 | Permit Rate, 2023 | Permit Rate, 2024 | Permit Rate, 2025 |
| Austin-Round Rock-San Marcos, TX | 5.9 | 8.4 | 10.8 | 9.1 | 8.7 | 5.9 | 4.5 |
| Charlotte-Concord-Gastonia, NC-SC | 3.1 | 2.5 | 3.4 | 2.9 | 3.6 | 2.4 | 2.0 |
| Seattle-Tacoma-Bellevue, WA | 4.1 | 3.2 | 5.1 | 4.5 | 2.4 | 2.4 | 2.0 |
| New York-Newark-Jersey City, NY-NJ | 2.3 | 2.1 | 2.1 | 2.8 | 2.4 | 2.1 | 1.6 |
| Washington-Arlington-Alexandria, DC-VA-MD-WV | 2.2 | 1.8 | 2.2 | 3.8 | 2.0 | 1.5 | 1.1 |
| Boston-Cambridge-Newton, MA-NH | 2.0 | 1.8 | 2.2 | 1.8 | 1.3 | 1.4 | 1.1 |
| Indianapolis-Carmel-Greenwood, IN | 1.2 | 1.1 | 1.4 | 2.2 | 2.3 | 1.1 | 0.9 |
| Portland-Vancouver-Hillsboro, OR-WA | 3.5 | 2.3 | 2.6 | 2.7 | 1.9 | 1.2 | 0.8 |
| San Antonio-New Braunfels, TX | 2.6 | 2.3 | 3.1 | 5.1 | 2.7 | 1.4 | 0.7 |
| St. Louis, MO-IL | 0.6 | 0.7 | 0.9 | 1.5 | 0.8 | 0.7 | 0.5 |
| Memphis, TN-MS-AR | 0.3 | 0.6 | 0.7 | 0.6 | 0.7 | 1.1 | 0.1 |
Markets at the highest permit rate since 2019
Six markets are seeing their highest permit rate since 2019. The increase in Columbus, OH, could be associated with the city’s “Zone In” zoning reform, which is expected to enable the development of up to 88,000 additional residential units over the next decade. The increase in Las Vegas, NV, looks more like a rebound from the rate’s retreat in 2024. The acceleration in permit rates in Cleveland, OH, Oklahoma City, OK, Providence, RI, and Birmingham, AL is also encouraging. While the current rate in these markets is still low, these legacy low-growth markets appear to be finally ticking up, which could give renters more fresh options to choose from.
Table 3: Markets at the highest permit rate since 2019
| Market | Permit Rate, 2019 | Permit Rate, 2020 | Permit Rate, 2021 | Permit Rate, 2022 | Permit Rate, 2023 | Permit Rate, 2024 | Permit Rate, 2025 |
| Columbus, OH | 1.6 | 3.1 | 2.4 | 2.9 | 2.6 | 3.4 | 4.3 |
| Las Vegas-Henderson-North Las Vegas, NV | 1.6 | 1.3 | 1.5 | 1.5 | 1.2 | 1.0 | 1.9 |
| Oklahoma City, OK | 0.2 | 0.2 | 0.1 | 0.3 | 0.3 | 0.8 | 0.9 |
| Birmingham, AL | 0.1 | 0.3 | 0.5 | 0.8 | 0.3 | 0.5 | 0.9 |
| Providence-Warwick, RI-MA | 0.1 | 0.1 | 0.1 | 0.2 | 0.3 | 0.5 | 0.7 |
| Cleveland, OH | 0.1 | 0.2 | 0.1 | 0.3 | 0.4 | 0.5 | 0.6 |
Markets see largest increase in permit rates
Florida’s rental markets top the list. After a broad retreat in permitting activity in 2024, the rebound across these markets in 2025 points to further rent relief for renters in the years ahead. Specifically, there are 4.5 new multifamily units permitted for every 1,000 residents in Orlando, FL, and 2.6 new multifamily units permitted for every 1,000 residents in Miami, FL, which are both on par with the peak rate seen in 2021.
The pickup in permitting activity in San Jose, CA is also encouraging, as it could eventually bring some downward pressure on rents. In June 2026, San Jose’s median asking rent grew 3.3% year-over-year to $3,423 — the highest level in our data record, which goes back to March 2019. That faster growth is likely tied to the AI boom in the Bay Area, which has pushed up both demand and rents in the market.
Table 4: Markets see largest increase in permit rates, 2024 vs 2025
| Market | Permit Rate, 2019 | Permit Rate, 2020 | Permit Rate, 2021 | Permit Rate, 2022 | Permit Rate, 2023 | Permit Rate, 2024 | Permit Rate, 2025 | Changes (2024 vs 2025) |
| Orlando-Kissimmee-Sanford, FL | 3.4 | 3.2 | 4.6 | 4.3 | 2.9 | 2.9 | 4.5 | 1.6 |
| Jacksonville, FL | 1.9 | 2.4 | 3.6 | 5.1 | 4.3 | 1.0 | 2.1 | 1.1 |
| Miami-Fort Lauderdale-West Palm Beach, FL | 2.1 | 2.2 | 2.7 | 2.0 | 2.4 | 1.6 | 2.6 | 1.0 |
| San Jose-Sunnyvale-Santa Clara, CA | 1.8 | 2.0 | 1.1 | 2.8 | 2.1 | 0.9 | 1.8 | 0.9 |
| Columbus, OH | 1.6 | 3.1 | 2.4 | 2.9 | 2.6 | 3.4 | 4.3 | 0.9 |
| Las Vegas-Henderson-North Las Vegas, NV | 1.6 | 1.3 | 1.5 | 1.5 | 1.2 | 1.0 | 1.9 | 0.9 |
Markets where the permit rate dropped most
While Austin, TX has the highest permit rate in 2025 across the 50 metros, at 4.5 new multifamily units per 1,000 residents, it is also the market seeing the largest rate drop between 2024 and 2025. Milwaukee, WI and Atlanta, GA are both slowing as well, but their rates remain above pre-pandemic levels, suggesting robust underlying pipelines. New York metro is the most concerning market in the dataset. Its permit rate has not only fallen to its lowest level since 2019, but the decline from 2024 to 2025 was also its sharpest year-over-year rate drop on record.
Table 5: Markets where the permit rate dropped most, 2024 vs 2025
| Market | Permit Rate, 2019 | Permit Rate, 2020 | Permit Rate, 2021 | Permit Rate, 2022 | Permit Rate, 2023 | Permit Rate, 2024 | Permit Rate, 2025 | Changes (2024 vs 2025) |
| Austin-Round Rock-San Marcos, TX | 5.9 | 8.4 | 10.8 | 9.1 | 8.7 | 5.9 | 4.5 | -1.4 |
| Memphis, TN-MS-AR | 0.3 | 0.6 | 0.7 | 0.6 | 0.7 | 1.1 | 0.1 | -1.0 |
| San Antonio-New Braunfels, TX | 2.6 | 2.3 | 3.1 | 5.1 | 2.7 | 1.4 | 0.7 | -0.7 |
| Milwaukee-Waukesha, WI | 0.4 | 0.5 | 0.5 | 0.8 | 0.7 | 1.3 | 0.7 | -0.6 |
| Atlanta-Sandy Springs-Roswell, GA | 1.1 | 0.6 | 1.2 | 3.4 | 2.2 | 2.2 | 1.7 | -0.5 |
| New York-Newark-Jersey City, NY-NJ | 2.3 | 2.1 | 2.1 | 2.8 | 2.4 | 2.1 | 1.6 | -0.5 |
Appendix: Rental Data – 50 Largest Metropolitan Areas – June 2026
| Market | Median Asking Rent | YOY | Multifamily units permitted per 1,000 residents (2025) |
| Atlanta-Sandy Springs-Roswell, GA | $1,561 | -3.2% | 1.7 |
| Austin-Round Rock-San Marcos, TX | $1,371 | -4.3% | 4.5 |
| Baltimore-Columbia-Towson, MD | $1,835 | 0.7% | 0.8 |
| Birmingham, AL | $1,202 | -1.2% | 0.9 |
| Boston-Cambridge-Newton, MA-NH | $2,930 | -4.1% | 1.1 |
| Buffalo-Cheektowaga, NY | NA | NA | 0.4 |
| Charlotte-Concord-Gastonia, NC-SC | $1,495 | -2.5% | 2.0 |
| Chicago-Naperville-Elgin, IL-IN | $1,833 | 1.3% | 0.6 |
| Cincinnati, OH-KY-IN | $1,326 | 0.0% | 1.1 |
| Cleveland, OH | $1,204 | -1.0% | 0.6 |
| Columbus, OH | $1,180 | -1.5% | 4.3 |
| Dallas-Fort Worth-Arlington, TX | $1,461 | -2.7% | 2.9 |
| Denver-Aurora-Centennial, CO | $1,770 | -3.1% | 2.6 |
| Detroit-Warren-Dearborn, MI | $1,256 | -3.0% | 0.7 |
| Hartford-West Hartford-East Hartford, CT | NA | NA | 0.8 |
| Houston-Pasadena-The Woodlands, TX | $1,381 | -2.8% | 2.1 |
| Indianapolis-Carmel-Greenwood, IN | $1,270 | -1.7% | 0.9 |
| Jacksonville, FL | $1,478 | -2.3% | 2.1 |
| Kansas City, MO-KS | $1,431 | 1.6% | 1.9 |
| Las Vegas-Henderson-North Las Vegas, NV | $1,456 | -1.8% | 1.9 |
| Los Angeles-Long Beach-Anaheim, CA | $2,776 | -1.7% | 1.0 |
| Louisville/Jefferson County, KY-IN | $1,219 | -2.2% | 1.7 |
| Memphis, TN-MS-AR | $1,112 | -4.2% | 0.1 |
| Miami-Fort Lauderdale-West Palm Beach, FL | $2,277 | -2.6% | 2.6 |
| Milwaukee-Waukesha, WI | $1,722 | 0.3% | 0.7 |
| Minneapolis-St. Paul-Bloomington, MN-WI | $1,513 | 0.1% | 1.4 |
| Nashville-Davidson–Murfreesboro–Franklin, TN | $1,479 | -5.3% | 2.6 |
| New Orleans-Metairie, LA | $1,155 | -8.0% | 0.3 |
| New York-Newark-Jersey City, NY-NJ | $2,968 | 1.7% | 1.6 |
| Oklahoma City, OK | $920 | -2.1% | 0.9 |
| Orlando-Kissimmee-Sanford, FL | $1,683 | -1.9% | 4.5 |
| Philadelphia-Camden-Wilmington, PA-NJ-DE-MD | $1,749 | -1.8% | 0.8 |
| Phoenix-Mesa-Chandler, AZ | $1,433 | -4.2% | 2.8 |
| Pittsburgh, PA | $1,458 | 2.8% | 0.9 |
| Portland-Vancouver-Hillsboro, OR-WA | $1,603 | -1.5% | 0.8 |
| Providence-Warwick, RI-MA | NA | NA | 0.7 |
| Raleigh-Cary, NC | $1,434 | -2.5% | 3.5 |
| Richmond, VA | $1,525 | -0.9% | 3.1 |
| Riverside-San Bernardino-Ontario, CA | $2,055 | -2.6% | 1.1 |
| Rochester, NY | NA | NA | 0.4 |
| Sacramento-Roseville-Folsom, CA | $1,829 | -1.5% | 1.0 |
| St. Louis, MO-IL | $1,292 | -1.4% | 0.5 |
| San Antonio-New Braunfels, TX | $1,159 | -4.8% | 0.7 |
| San Diego-Chula Vista-Carlsbad, CA | $2,675 | -2.8% | 2.2 |
| San Francisco-Oakland-Fremont, CA | $2,907 | 1.9% | 1.1 |
| San Jose-Sunnyvale-Santa Clara, CA | $3,423 | 3.3% | 1.8 |
| Seattle-Tacoma-Bellevue, WA | $1,880 | -1.1% | 2.0 |
| Tampa-St. Petersburg-Clearwater, FL | $1,638 | -5.0% | 2.6 |
| Virginia Beach-Chesapeake-Norfolk, VA-NC | $1,581 | 2.0% | 0.4 |
| Washington-Arlington-Alexandria, DC-VA-MD-WV | $2,293 | -2.3% | 1.1 |
Methodology
Rental data as of June 2026 for studio, 1-bedroom, or 2-bedroom units advertised for rent on Realtor.com. Rental units include apartments as well as private rentals (condos, townhomes, single-family homes). We use rental sources that reliably report data each month within the 50 largest metropolitan areas. Realtor.com began publishing regular monthly rental trends reports in October 2020 with data history stretching to March 2019.
Building permit data is sourced from Building Permits Survey (BPS). Metro level population is obtained from Moody’s estimates.

